Plotting comparisons
The bnmetrics.viz functions are gated behind the optional [viz]
extra (graphviz, plotly, ipython); calling them without the
extra installed raises an ImportError with an actionable hint.
Side-by-side comparison
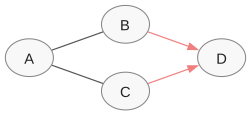
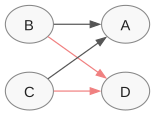
bnmetrics.plot_side_by_side(g1, g2, name1=..., name2=...) renders two
graphs as paired graphviz diagrams. Edges that match between the
two panels (same skeleton, same orientation) are highlighted in
pastel red so true positives stand out from errors:
import numpy as np
import bnmetrics

true_cpdag = bnmetrics.to_graphlike(
    np.array([
        [0, 1, 1, 0],
        [1, 0, 0, 2],
        [1, 0, 0, 2],
        [0, 1, 1, 0],
    ], dtype=np.int8),
    var_names=("A", "B", "C", "D"),
)
recovered = bnmetrics.to_graphlike(
    np.array([
        [0, 1, 1, 0],
        [2, 0, 0, 2],
        [2, 0, 0, 2],
        [0, 1, 1, 0],
    ], dtype=np.int8),
    var_names=("A", "B", "C", "D"),
)

bnmetrics.plot_side_by_side(
    true_cpdag, recovered,
    name1="truth", name2="recovered",
    direction="LR",
    save="comparison.svg",
)
truth |
recovered |
|---|---|
|
|
save accepts either a single path (the renderer derives two
sibling filenames from name1 and name2) or an explicit
(path_left, path_right) tuple. The direction argument controls
graphviz layout — "LR" (left-to-right) or "TB" (top-to-bottom).
The matched edges (B → D and C → D in this fixture) appear in
pastel red in both panels; the reversed upper edges fall back to
the default stroke.
Single-graph rendering with highlights
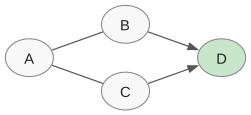
bnmetrics.plot_graph(g, highlight=[...]) renders a single graph with
selected nodes painted in a highlight colour. This is the building
block underneath both plot_side_by_side and analyse_mb:
bnmetrics.plot_graph(true_cpdag, highlight=["D"], direction="LR",
               save="true_with_D_highlighted.svg")
SID incorrect-edge heatmap
bnmetrics.plot_sid_matrix renders the \((i, j)\) indicator matrix of
intervention pairs on which the recovered graph predicts a
different distribution than the reference. bnmetrics.sid requires the
reference (g1) to be a pure DAG; the recovered graph may be a
DAG or a CPDAG (the latter yields separate lower/upper bounds).
true_dag = bnmetrics.to_graphlike(
    np.array([
        [0, 2, 2, 0],   # A → B, A → C
        [1, 0, 0, 2],   # B → D
        [1, 0, 0, 2],   # C → D
        [0, 1, 1, 0],
    ], dtype=np.int8),
    var_names=("A", "B", "C", "D"),
)
recovered_dag = bnmetrics.to_graphlike(
    np.array([
        [0, 1, 2, 0],   # A → C, but B → A (reversed)
        [2, 0, 0, 2],
        [1, 0, 0, 2],
        [0, 1, 1, 0],
    ], dtype=np.int8),
    var_names=("A", "B", "C", "D"),
)

sid_result = bnmetrics.sid(true_dag, recovered_dag)
sid_result.sid              # 5
bnmetrics.plot_sid_matrix(sid_result, save="sid_matrix.html")

The save format is inferred from the file extension. .html is
the default; static-image formats (.png, .svg, .pdf,
.jpg, .jpeg, .webp) additionally require kaleido
(pip install kaleido).